
Your marketing invoice this month says $18,000. It said $18,000 in January too, so you filed it and moved on. You are buying six fewer roofs with that money than you were eleven months ago, and nothing on the invoice will ever tell you.
Cost creep is the price of each lead rising a few dollars at a time while your total marketing spend stays flat. It works like rot under the shingles. The roof looks fine from the driveway for years, and you find out what has been going on up there the morning of the tear-off.
What cost creep does to a roofing company’s gross profit
Say you run a roofing company spending $18,000 a month on marketing. Your average roof replacement sells for $14,000 at a 32 percent gross margin. Gross margin is the money left after you pay for material and the crew that installed it, so each roof puts about $4,480 of gross profit into the company.
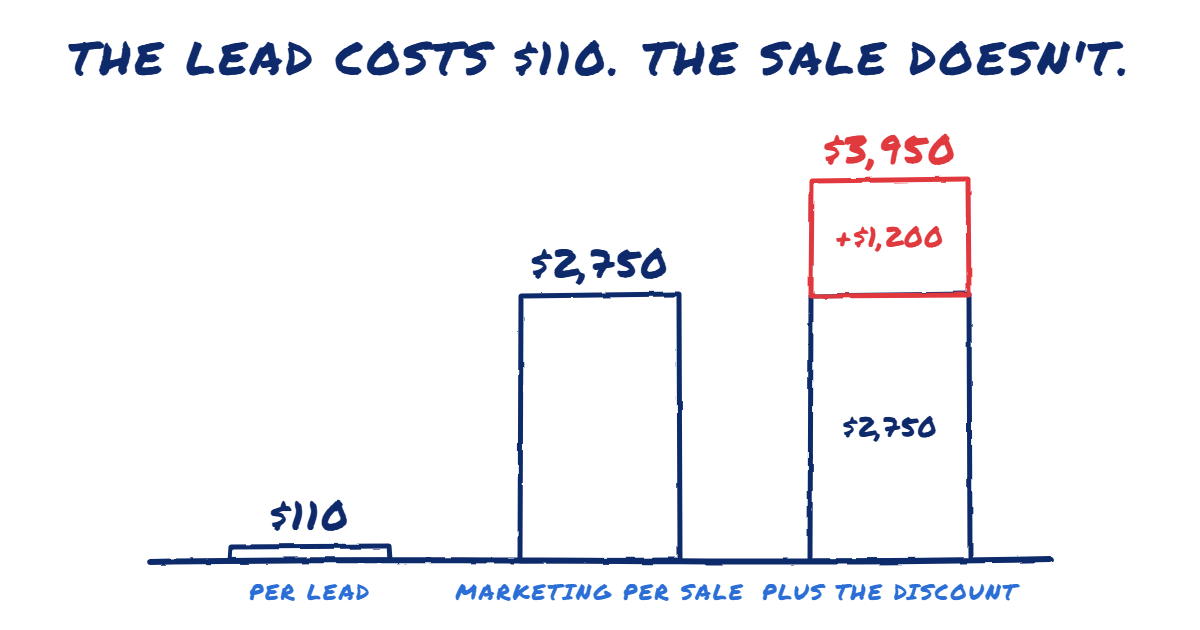
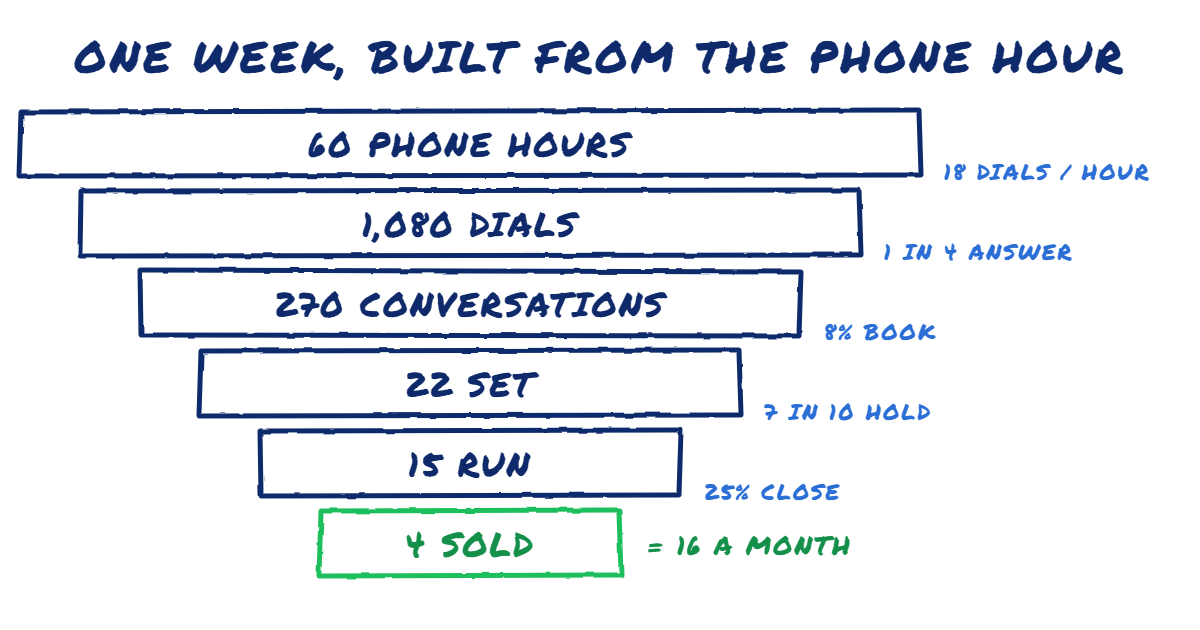
In January your cost per lead, what you pay in marketing for each homeowner who raises a hand, is $120. That $18,000 buys 150 leads. Half agree to an appointment, so 75 get set. Eight in ten of those actually happen, so 60 get run. Your closer sells three in ten. That is 18 roofs and $80,640 of gross profit.
Now let the cost per lead drift up $5 a month. Paid search got pricier when a competitor started bidding on your keywords, the mail piece went stale, and the call center started leaving more voicemails.
By December you are paying $175 a lead. The same $18,000 buys about 103 leads. That becomes 51 appointments set, 41 run, and 12 roofs, and gross profit for the month lands near $55,000.
You spent the same money. You sold six fewer roofs and made about $25,000 less gross profit, in a month where the invoice matched January’s to the dollar.
Add up the whole year against a year where you held $120, and the gap is about 38 roofs and roughly $169,000 of gross profit. That is more than $14,000 a month, lost five dollars at a time. On a siding wrap or a ten-window package carrying $4,800 of gross profit, the hole gets deeper, because every lost sale is worth more.
Why your monthly marketing report never catches it
Most owners review marketing the way they review the phone bill. If the total matched, there was nothing to talk about.
The total is the one number creep never touches. It hides inside the rates, and $5 a month is too small for any single month to look wrong. It works like a supplier price increase you swallow without passing it on, except this one empties your calendar instead of thinning your job.
By the time it shows up as a thin December and an empty January, eleven months are spent and you cannot get a dollar back. A number with no plan next to it tells you nothing.
The marketing KPIs to track daily and weekly
A KPI, short for key performance indicator, is a number you check to see whether things are on track. This system is the marketing half of the weekly profit review you should already be running. Keep it small. Nobody runs a siding company and also maintains a dashboard, and a system you keep all year beats a better one you drop in March.
Daily, you watch one number: appointments set. Whoever runs your phones texts you yesterday’s count every morning. Leads and clicks wait for the weekly sheet.
Weekly, you watch four: cost per lead by source, leads in, appointments set, and appointments actually run. The whole thing fits on one sheet of paper.
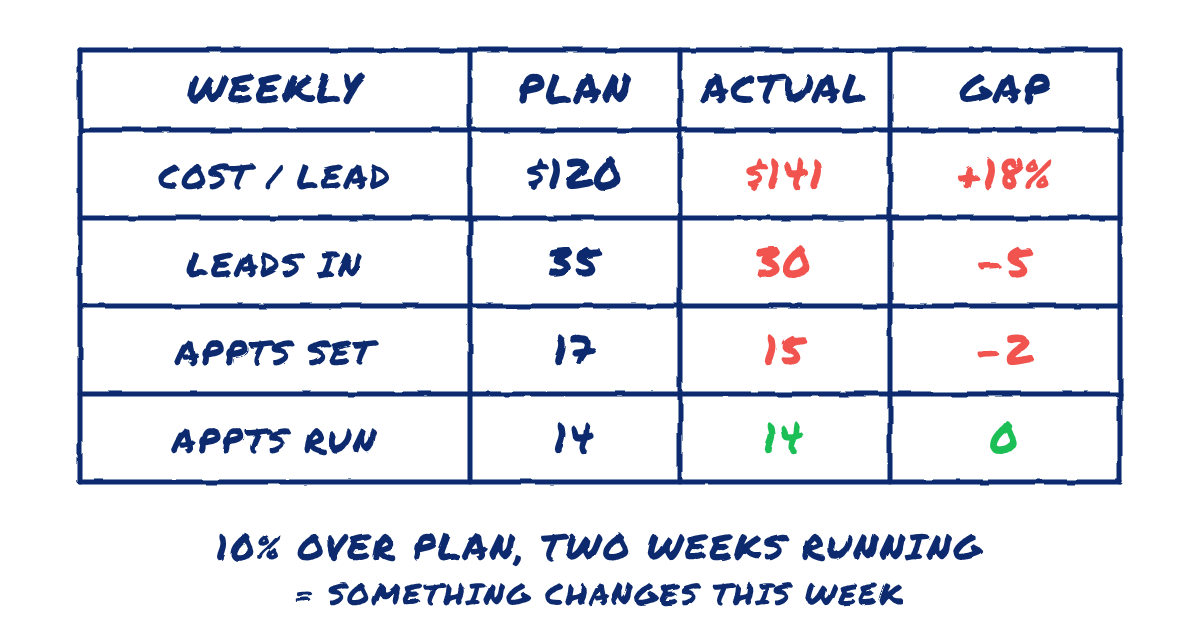
Next to each number, write what you planned. Thirty-five leads at $120, seventeen appointments set, fourteen run. Then write what happened. The sheet is useless without both columns, because the gap between them is the only part that tells you anything.
No stories at the Monday meeting
Most tracking systems die in this meeting. Your marketing person says leads were soft, the weather was bad, and the new campaign is still learning. Everybody nods. In a lot of companies, a missed number plus a good excuse gets treated like a hit.
Open with the gap and nothing else. “We planned 35 leads at $120 and got 30 at $141.” Two numbers and no adjectives make it arithmetic instead of blame, and they put you and the person running your phones on the same side of the table, looking at the same sheet.
Then set a trigger. If cost per lead runs 10 percent over plan two weeks in a row, something changes that week. In the roofing example, 10 percent over is $132 a lead, which still buys about 16 roofs a month. Catching it there costs you a roof or two a month. Catching it in December costs you 38 over the year.
Tie the review to a meeting you already hold
A new habit on your calendar will lose to a callback on a job in Hamilton every time. Hook the review to something that already happens without anyone remembering it, like the end of the Monday production meeting. Everyone is already sitting down, so the sheet takes ten minutes.
Do this Monday
Pull your marketing spend and lead count for last month and for the same month last year. Divide spend by leads for both to get your cost per lead. If this year’s number is more than 10 percent higher, the rot is already up there, and you have been paying for it with jobs you never sold.
Then write next Monday’s four numbers on a sheet with a plan column and hand a copy to whoever answers your phones. Run it for eight weeks before you judge it.